前提
この記事では以下を前提としています。
- Next.js のバージョンは 14.0.0
- Chart.js のバージョンは 4.4.1
- react-chartjs-2 を使用し、使用バージョンは 5.2.0
- chartjs-plugin-annotation を使用し、使用バージョンは 3.0.1
この記事のゴール
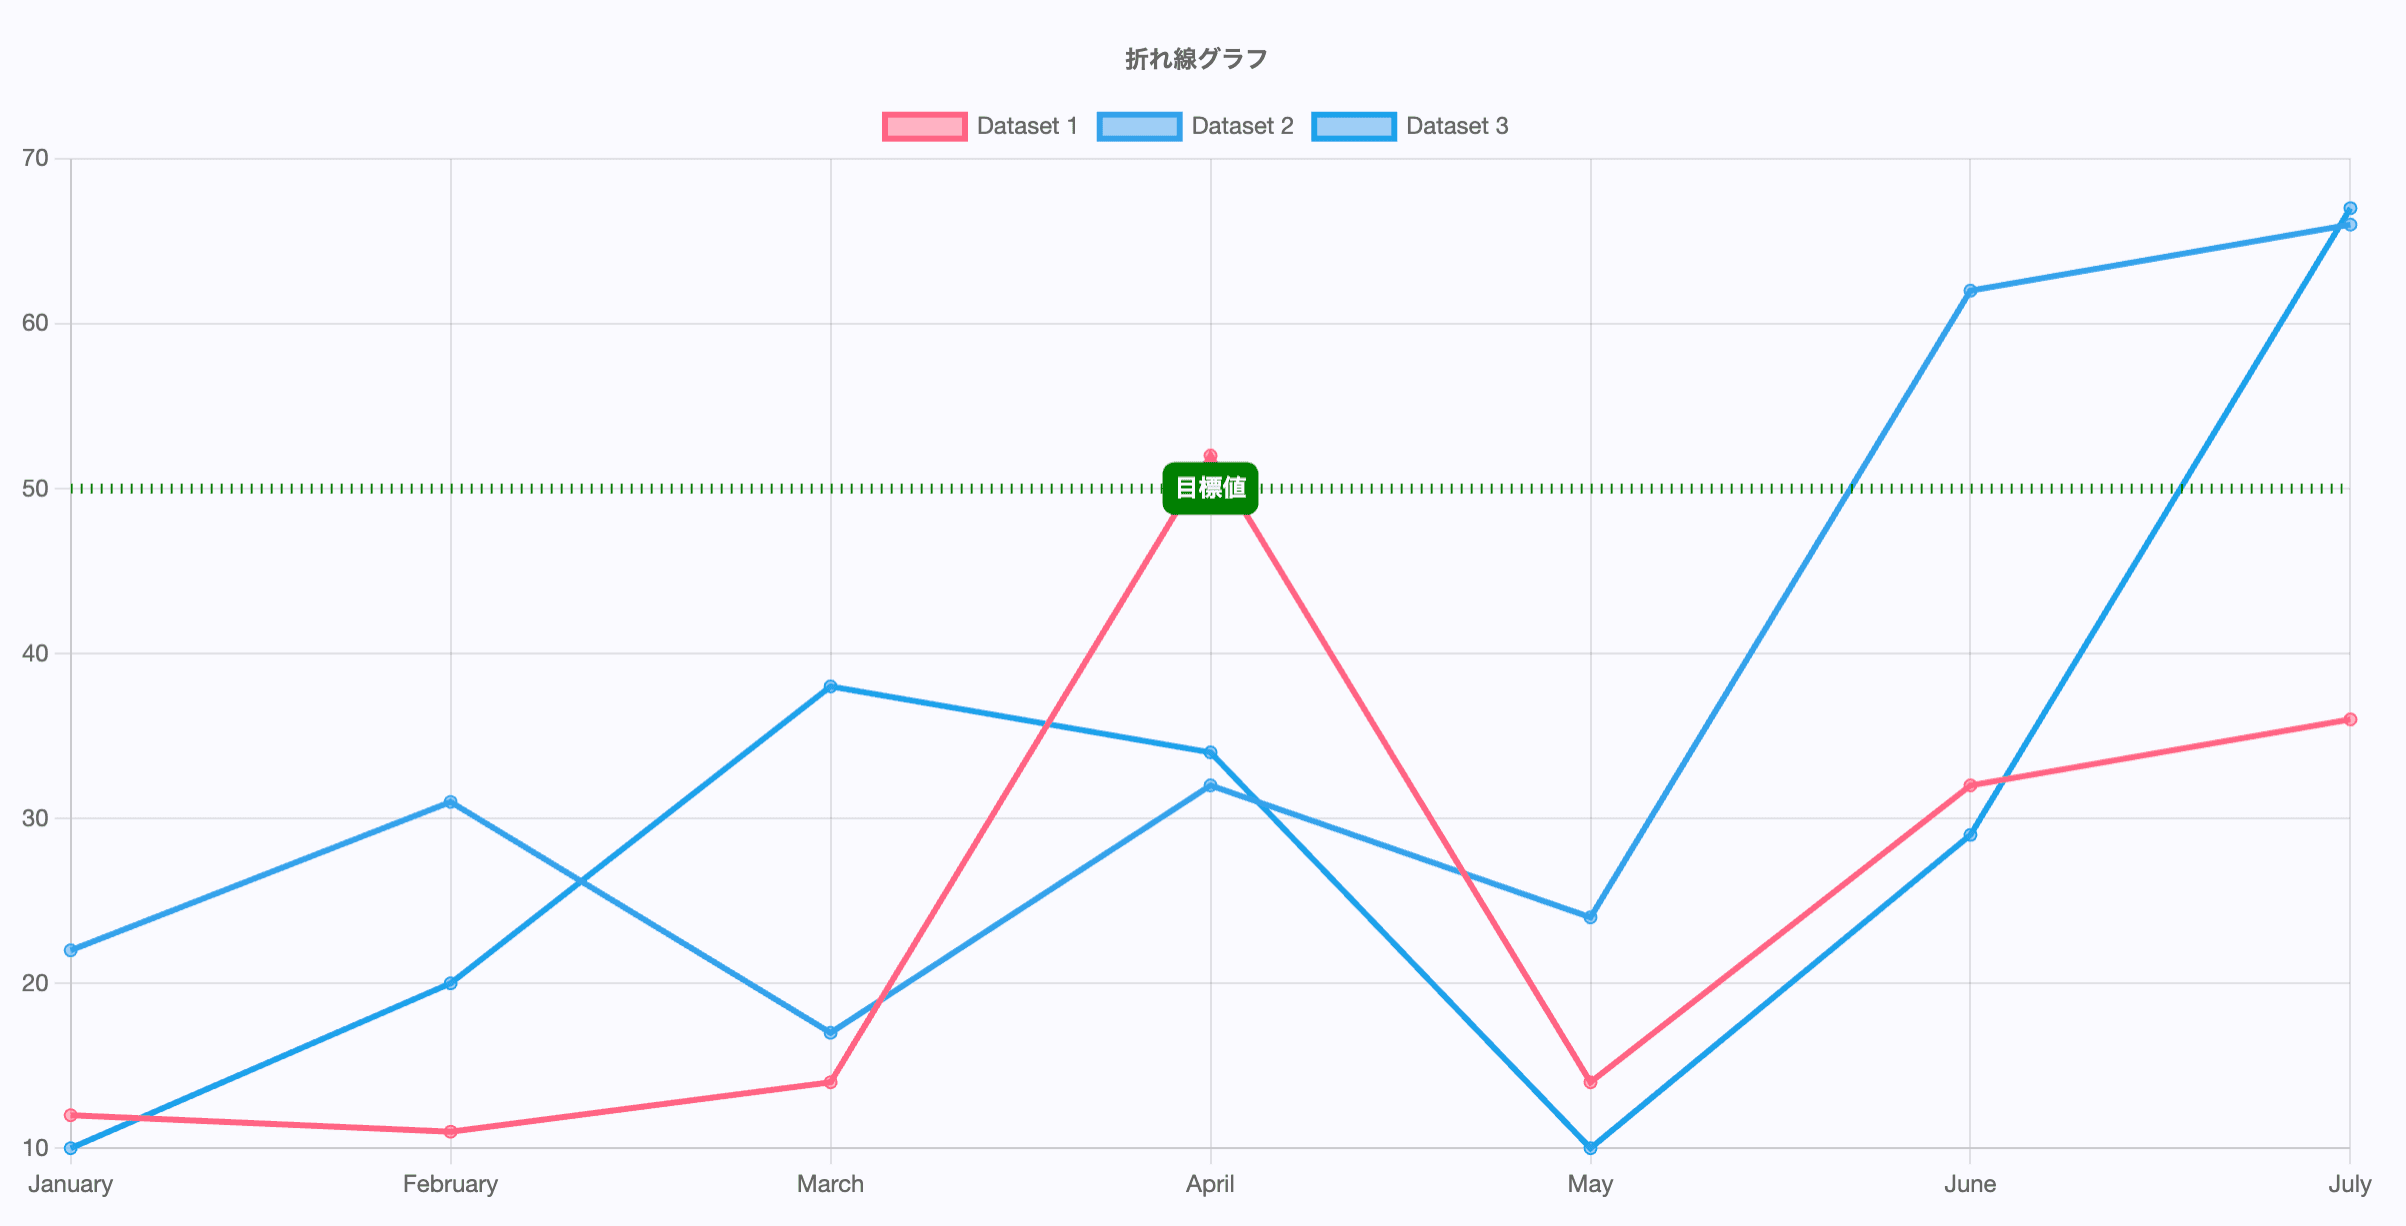
この記事では、以下のように Next.js と Chart.js(react-chartjs-2を使用)で表示した折れ線グラフや棒グラフに目標値や境界値などの線を追加表示することをゴールとします。
react-chartjs-2 をインストールする
Next.js で Chart.js を使用するために今回はreact-chartjs-2を追加します。
react-chartjs-2を追加
$ yarn add chart.js react-chartjs-2react-chartjs-2
React components for Chart.js, the most popular charting library.
react-chartjs-2.js.org
chartjs-plugin-annotation をインストールする
目安線/境界線の追加のために、chartjs-plugin-annotationというプラグインを使用します。
以下でchartjs-plugin-annotationをインストールします。
chartjs-plugin-annotationを追加
$ yarn add chartjs-plugin-annotation折れ線グラフに目安線/境界線を追加する
以下のようなコンポーネントにすることで、Next.js とreact-chartjs-2の組み合わせで折れ線グラフに目安線/境界線を追加することができます。
このコンポーネントを使うと冒頭の1番目のグラフ表示になります。
components/LineChart.tsx
'use client';
import {
Chart as ChartJS,
CategoryScale,
LinearScale,
PointElement,
LineElement,
Title,
Tooltip,
Legend,
} from 'chart.js';
import annotationPlugin from 'chartjs-plugin-annotation';
import { Line } from 'react-chartjs-2';
export default function LineChart() {
ChartJS.register(
CategoryScale,
LinearScale,
PointElement,
LineElement,
Title,
Tooltip,
Legend,
annotationPlugin, // annotationPluginを登録
);
// 適当なサンプルデータ
const data1 = [12, 11, 14, 52, 14, 32, 36];
const data2 = [22, 31, 17, 32, 24, 62, 66];
const data3 = [10, 20, 38, 34, 10, 29, 67];
// オプション
const options = {
responsive: true,
plugins: {
legend: {
position: 'top' as const,
},
title: {
display: true,
text: '折れ線グラフ',
},
// 目安線/境界線の追加
annotation: {
annotations: [
{
type: 'line' as const,
mode: 'horizontal',
scaleID: 'y',
value: 50, //目安線/境界線を表示するy軸の値
borderColor: 'green',
borderWidth: 5,
borderDash: [1, 4],
drawTime: 'afterDatasetsDraw' as const,
label: {
backgroundColor: 'green',
content: '目標値',
display: true,
},
},
],
},
},
};
const labels = [
'January',
'February',
'March',
'April',
'May',
'June',
'July',
];
const data = {
labels,
datasets: [
{
label: 'Dataset 1',
data: data1,
borderColor: 'rgb(255, 99, 132)',
backgroundColor: 'rgba(255, 99, 132, 0.5)',
},
{
label: 'Dataset 2',
data: data2,
borderColor: 'rgb(53, 162, 235)',
backgroundColor: 'rgba(53, 162, 235, 0.5)',
},
{
label: 'Dataset 3',
data: data3,
borderColor: 'rgb(28, 162, 235)',
backgroundColor: 'rgba(53, 162, 235, 0.5)',
},
],
};
return <Line options={options} data={data} />;
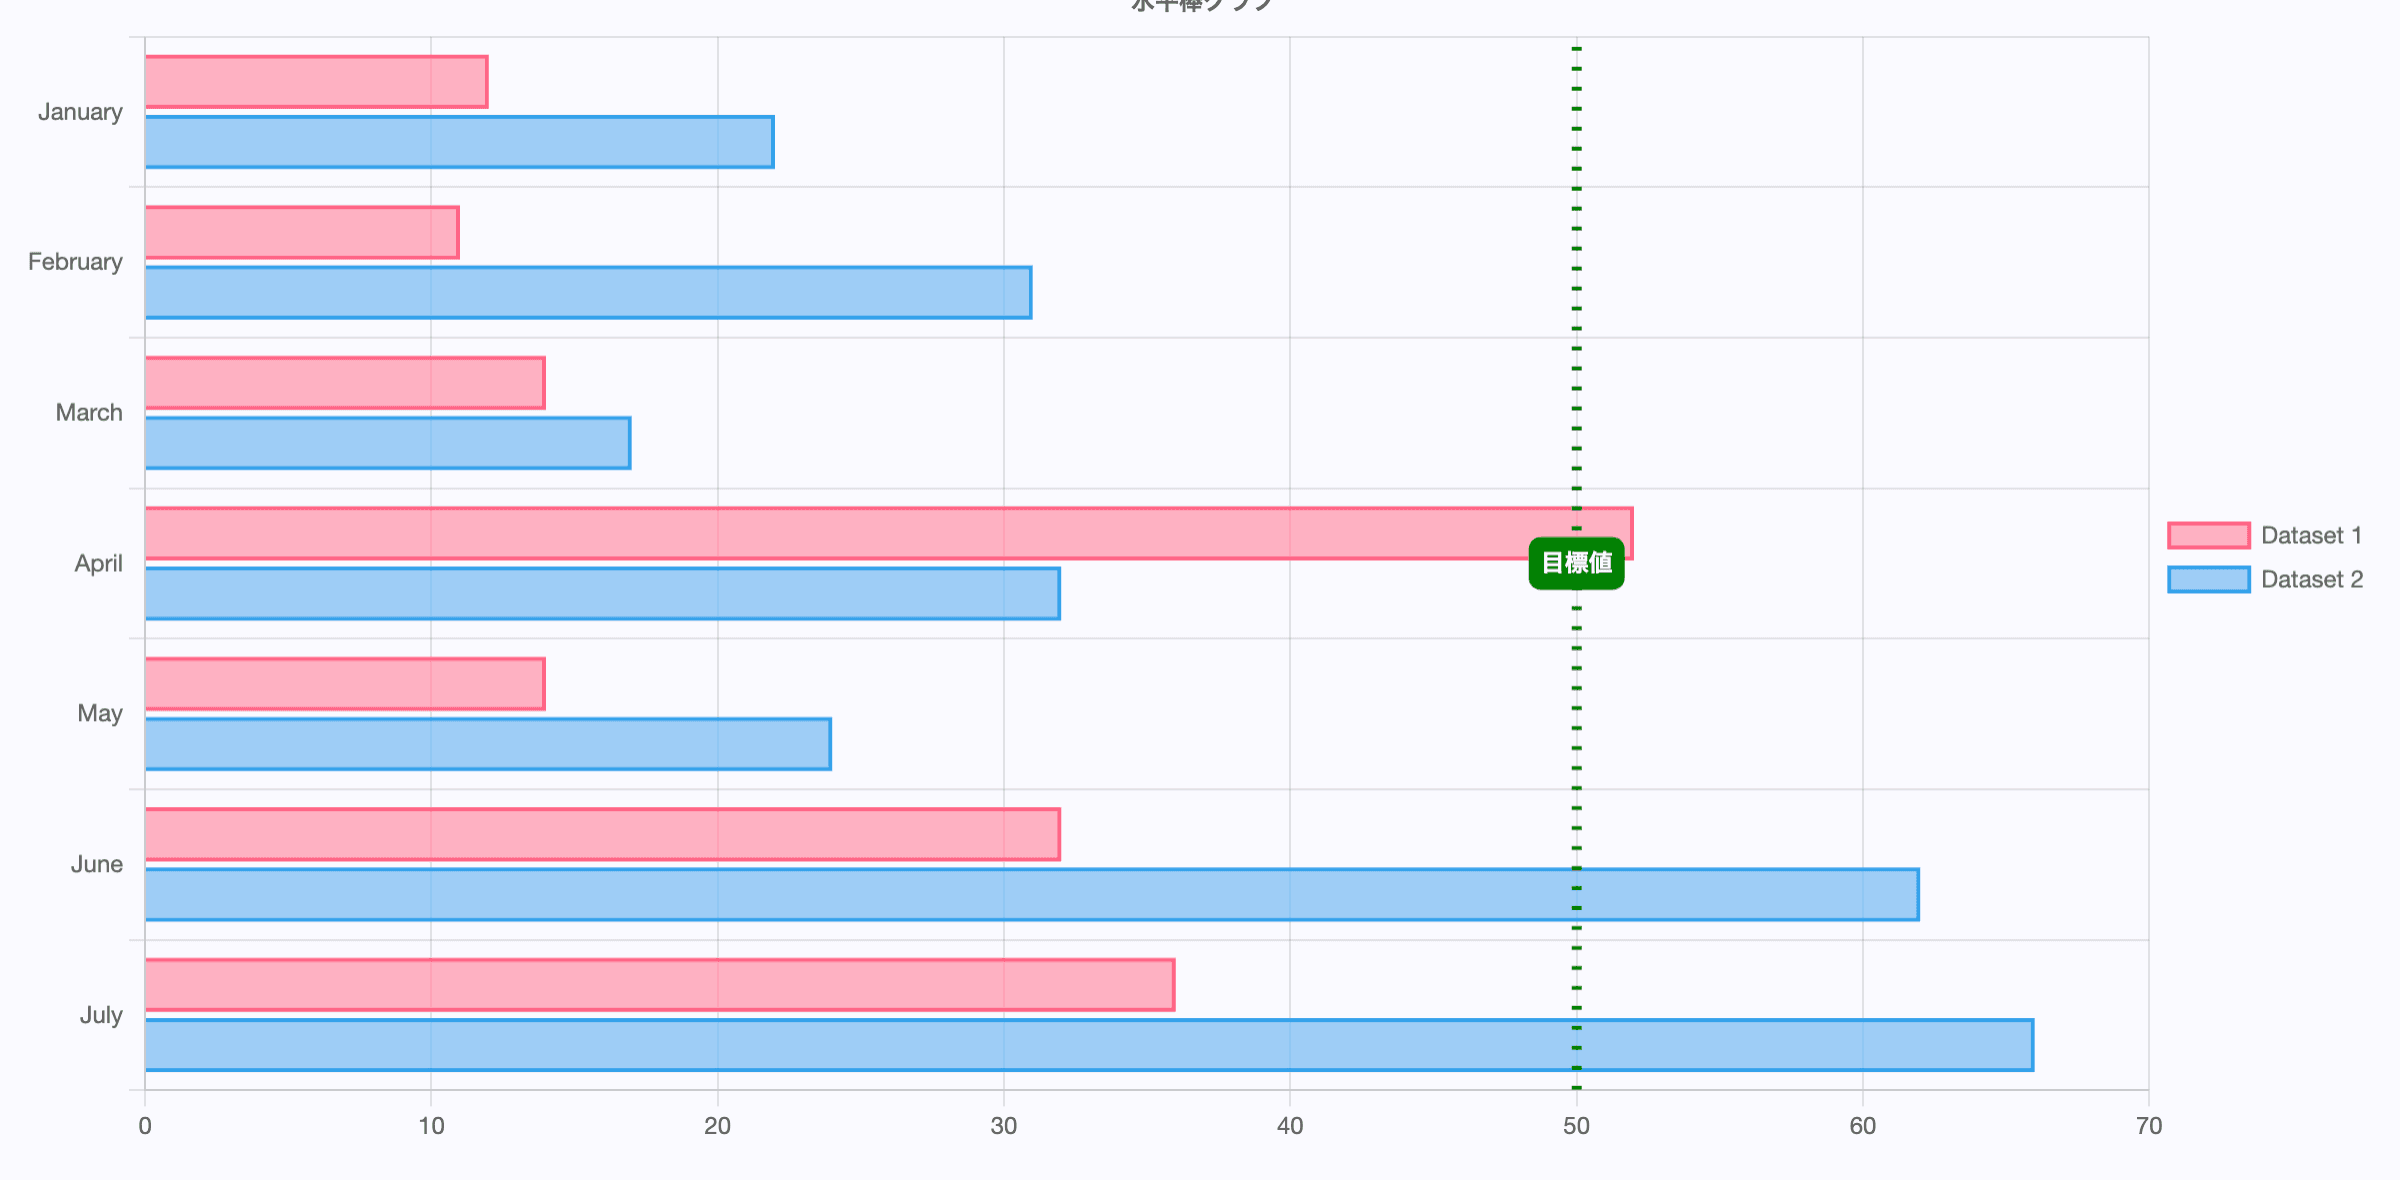
}水平棒グラフに目安線/境界線を追加する
以下は水平棒グラフと目安線を表示するコンポーネントです。折れ線の時と異なるのは、mode: 'vertical'とscaleID: 'x'です。
このコンポーネントを使うと冒頭の2番目のグラフ表示になります。
components/LineChart.tsx
'use client';
import {
  Chart as ChartJS,
  CategoryScale,
  LinearScale,
  BarElement,
  Title,
  Tooltip,
  Legend,
} from 'chart.js';
import annotationPlugin from 'chartjs-plugin-annotation';
import { Bar } from 'react-chartjs-2';

export default function HorizontalBarChart() {
  ChartJS.register(
    CategoryScale,
    LinearScale,
    BarElement,
    Title,
    Tooltip,
    Legend,
    annotationPlugin, // annotationPluginを登録
  );

  // 適当なサンプルデータ
  const data1 = [12, 11, 14, 52, 14, 32, 36];
  const data2 = [22, 31, 17, 32, 24, 62, 66];

  // オプション
  const options = {
    indexAxis: 'y' as const,
    elements: {
      bar: {
        borderWidth: 2,
      },
    },
    responsive: true,
    plugins: {
      legend: {
        position: 'right' as const,
      },
      title: {
        display: true,
        text: '水平棒グラフ',
      },
      maintainAspectRation: false,
      annotation: {
        annotations: [
          {
            type: 'line' as const,
            mode: 'vertical',
            scaleID: 'x',
            value: 50, //目安線/境界線を表示するx軸の値
            borderColor: 'green',
            borderWidth: 5,
            borderDash: [2, 8],
            borderDashOffset: 15,
            drawTime: 'afterDatasetsDraw' as const,
            label: {
              backgroundColor: 'green',
              content: '目標値',
              display: true,
            },
          },
        ],
      },
    },
  };

  const labels = [
    'January',
    'February',
    'March',
    'April',
    'May',
    'June',
    'July',
  ];

  const data = {
    labels,
    datasets: [
      {
        label: 'Dataset 1',
        data: data1,
        borderColor: 'rgb(255, 99, 132)',
        backgroundColor: 'rgba(255, 99, 132, 0.5)',
      },
      {
        label: 'Dataset 2',
        data: data2,
        borderColor: 'rgb(53, 162, 235)',
        backgroundColor: 'rgba(53, 162, 235, 0.5)',
      },
    ],
  };

  return <Bar options={options} data={data} />;
}annotationで指定できるオプションは以下の公式ドキュメントに全て記載されています。
まとめ
Next.js とreact-chartjs-2、chartjs-plugin-annotationを使用することでグラフに目安線/境界線を追加表示できます。